OpenTelemetry v26.9+
Maho ships native OpenTelemetry instrumentation: distributed traces, optional metric and log export, commerce-level span events, and W3C trace context propagation, all over OTLP/HTTP.
OTLP is the vendor-neutral standard, so Maho works with any observability backend that ingests it: Grafana Cloud (Tempo/Loki/Mimir), Sentry, Datadog, New Relic, Honeycomb, Elastic APM, Dynatrace, Jaeger, SigNoz, Axiom, Better Stack, or a self-hosted OpenTelemetry Collector. There is no vendor-specific code and no extra module per vendor: point the endpoint at your backend and go.
Everything is off by default. When tracing is disabled, Mage::getTracer() returns null and every instrumentation point is a no-op, so a store that does not use OpenTelemetry pays nothing.
Installation
The OpenTelemetry SDK is an optional dependency. Install it on any environment that should export telemetry:
nyholm/psr7 provides the PSR-17 HTTP factories the OTLP transport discovers at runtime (any psr/http-factory-implementation works).
Two more packages are needed only for specific features:
# Log export (the Export Logs setting)
composer require open-telemetry/opentelemetry-logger-monolog

# B3 propagation, only when OTEL_PROPAGATORS names b3 or b3multi
composer require open-telemetry/extension-propagator-b3
If you enable tracing without the SDK installed, Maho logs a warning to var/log/system.log and keeps running untraced (see Troubleshooting).
Quick start
Admin configuration lives under System > Configuration > Advanced > Developer > OpenTelemetry. Three fields are enough to start; every other setting has a working default:
- Enable Tracing: Yes
- OTLP Endpoint: the trace ingest URL of your backend, ending in
/v1/traces. For Grafana Cloud:https://otlp-gateway-prod-eu-west-2.grafana.net/otlp/v1/traces - Authorization Header: the credential your backend expects. For Grafana Cloud:
Basic [base64(instance_id:api_token)]
Traces start flowing on the next request. The default sampling rate is 0.1 (10% of requests), so on a quiet development store either raise it to 1.0 or refresh a page a few times.
For local development, a single container gives you a full backend (Grafana + Tempo + Loki + Mimir + an OTLP receiver on port 4318):
Point the OTLP Endpoint at http://localhost:4318/v1/traces and browse traces at http://localhost:3000 (Explore > Tempo).
What gets traced
One server span is created per request, then everything that happens inside it nests underneath:
| Span | Kind | Notes |
|---|---|---|
{METHOD} {module/controller/action} | SERVER | Request root span for storefront and admin pages, renamed after routing so trace lists group by route |
{METHOD} {api_route} | SERVER | Same for /api/* (REST, GraphQL, MCP): the API Platform route name, or api/{type} for the legacy SOAP/XML-RPC servers |
{OPERATION} {table} | CLIENT | Every database query. db.query.text carries the statement as executed (see Data safety) and can be switched off |
{METHOD} (HTTP client) | CLIENT | Outgoing requests through \Maho\Http\Client::create(). url.full is stripped of query string, fragment and userinfo. The span covers the whole exchange, from the request being issued to the body being read |
process {MessageClass} | CONSUMER | One span per queue message, continuing the trace of the request that dispatched it. The payload is never recorded |
BLOCK:*, OBSERVER:*, cron.job*, email.send, image.process, index.reindex, payment.* | INTERNAL | High-level profiler timers promoted to spans |
cache.* | INTERNAL | Cache reads, writes and invalidations. Off by default |
maho {command} | INTERNAL | Each CLI command is its own trace. Only the command name is recorded, never the arguments |
Nothing is traced until the request root span opens, so bootstrap work does not produce a scatter of single-span traces.
The root span also carries maho.store_id, maho.store_code, maho.website_id, maho.area (frontend, admin or api), http.route and http.response.status_code. Signed-in customers and admin users tag the trace with the pseudonymous enduser.id (the numeric id, never name or email).
Commerce span events
Business moments are recorded as span events on the active trace, with maho.* attributes and no PII:
| Event | Fires on | Attributes |
|---|---|---|
maho.order.placed | sales_order_place_after | maho.order.increment_id, maho.order.grand_total, maho.order.currency, maho.order.items_count, maho.payment.method |
maho.cart.add | checkout_cart_product_add_after | maho.product.id, maho.product.sku |
maho.checkout.success | checkout success page | maho.order.ids |
maho.customer.login | customer_login | none (sets enduser.id on the root span) |
Configuration reference
All settings live under System > Configuration > Advanced > Developer > OpenTelemetry and depend on Enable Tracing being set to Yes.
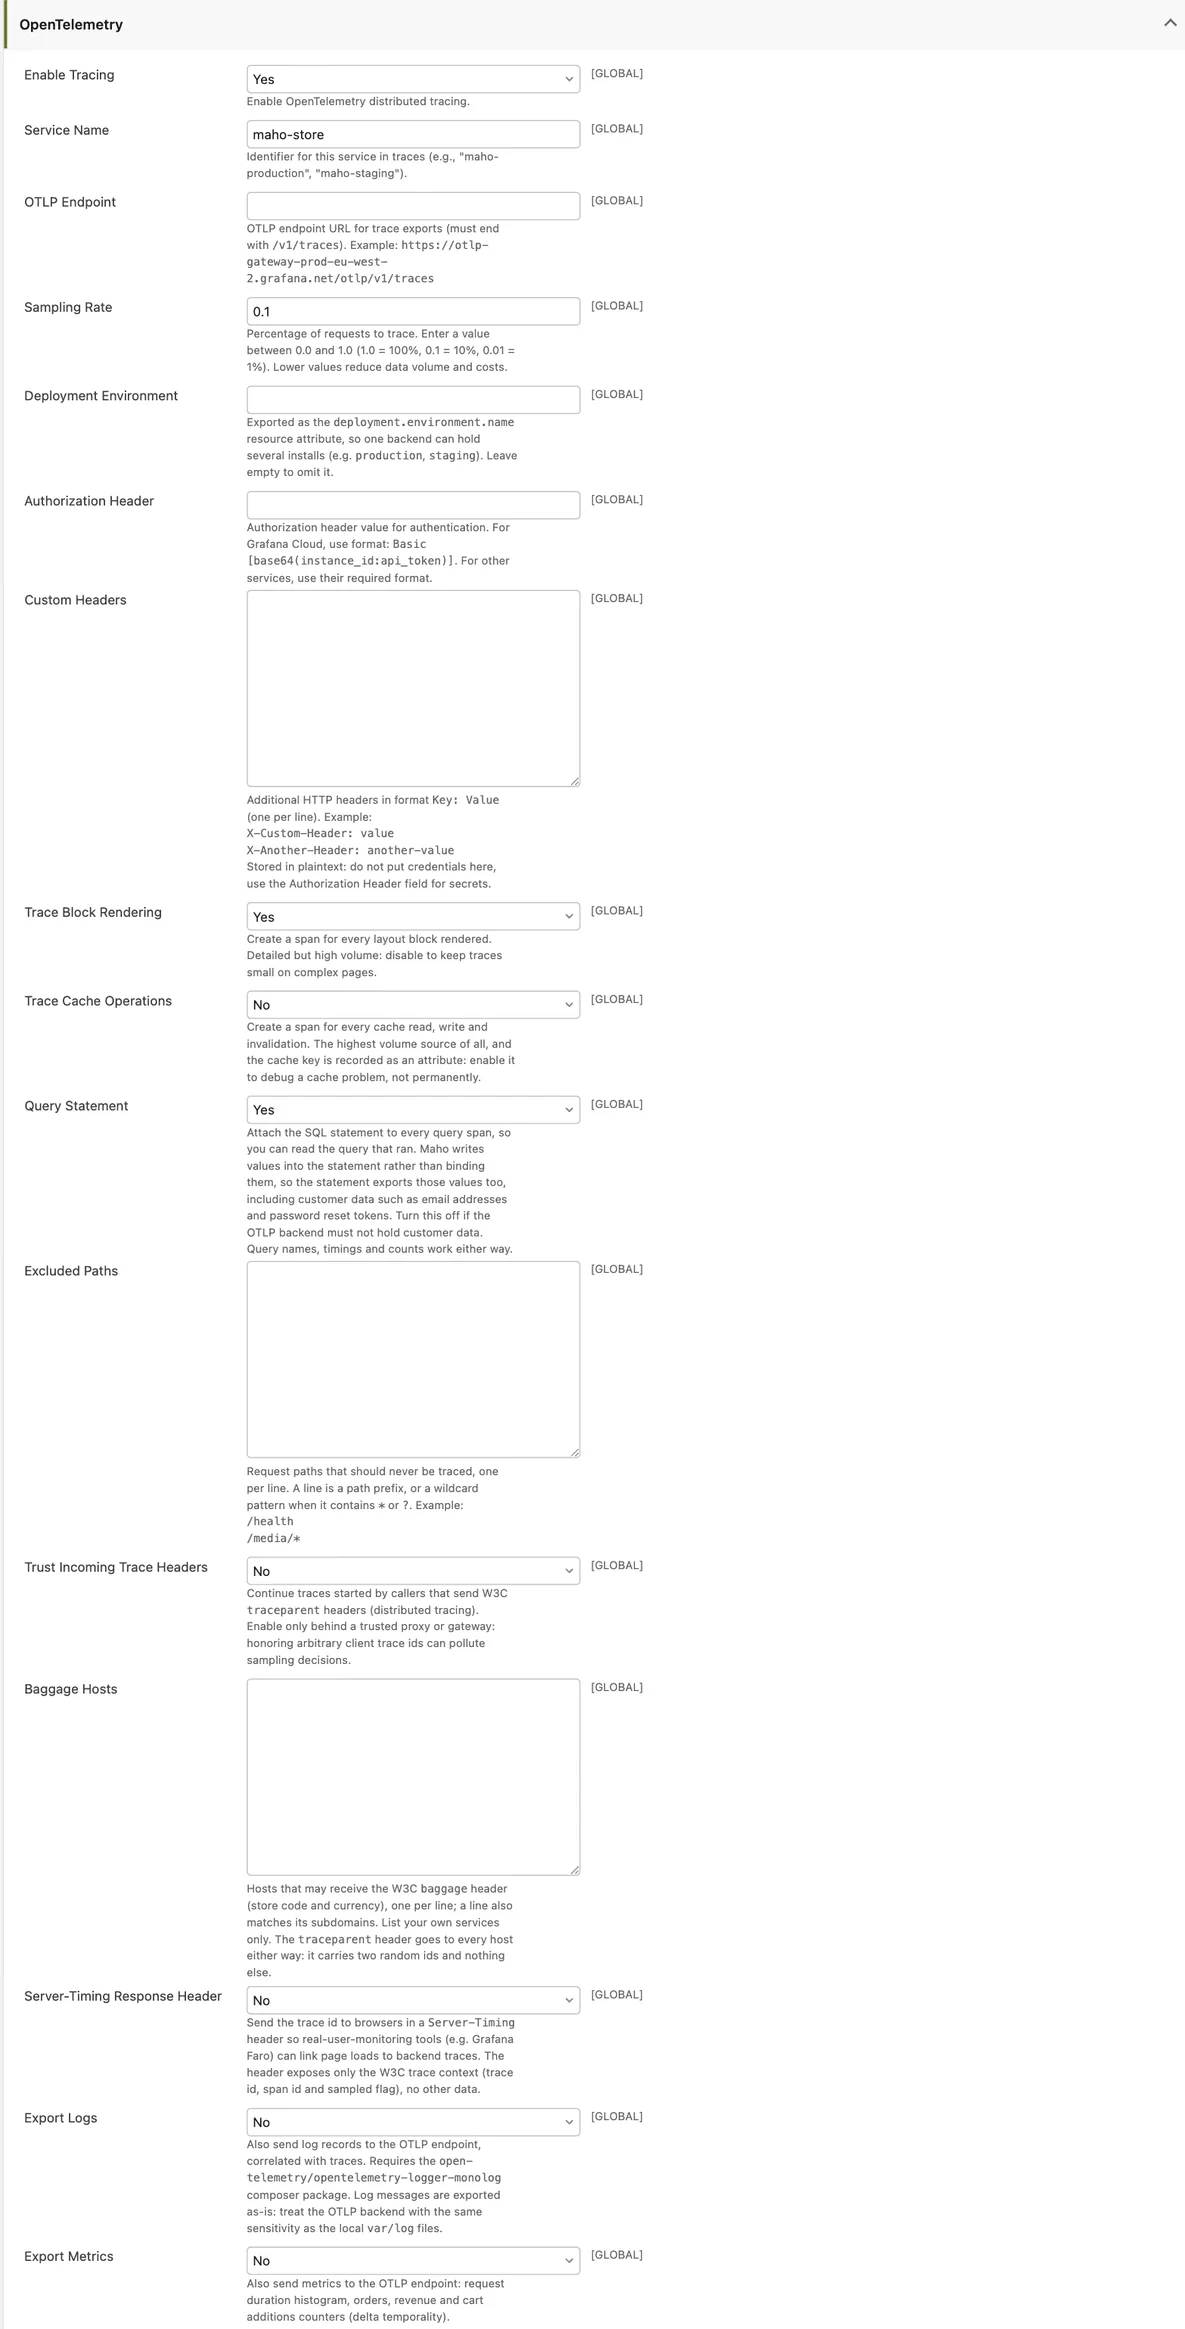
Connection
| Setting | Default | Description |
|---|---|---|
| Enable Tracing | No | Master switch for the admin-driven configuration |
| Service Name | maho-store | The service.name resource attribute, e.g. maho-production |
| OTLP Endpoint | empty | Trace ingest URL, must end with /v1/traces. The logs and metrics endpoints are derived from it by swapping the signal segment |
| Deployment Environment | empty | Exported as deployment.environment.name (e.g. production, staging) so one backend can hold several installs. Empty omits it |
| Authorization Header | empty | Value of the Authorization header sent to the endpoint. Stored encrypted in the database |
| Custom Headers | empty | Extra headers, one Key: Value per line. Stored in plaintext: keep credentials in the Authorization Header field |
Detail and volume dials
| Setting | Default | Description |
|---|---|---|
| Sampling Rate | 0.1 | Fraction of requests to trace, 0.0 to 1.0. Applied parent-based: a request continuing a sampled trace stays sampled |
| Trace Block Rendering | Yes | A span for every layout block rendered. Detailed but high volume: disable it to keep traces small on complex pages |
| Trace Cache Operations | No | A span for every cache read, write and invalidation. The highest-volume source of all, and the cache key is recorded as an attribute: enable it to debug a cache problem, not permanently |
| Query Statement | Yes | Attach the SQL statement to every query span as db.query.text. See Data safety |
| Excluded Paths | empty | Request paths that are never traced, one per line. A line is a path prefix, or a wildcard pattern when it contains * or ? (e.g. /health, /media/*) |
| Export Logs | No | Also ship Monolog records to the OTLP endpoint. See Log export |
| Export Metrics | No | Also ship metrics to the OTLP endpoint. See Metrics |
Propagation and safety
| Setting | Default | Description |
|---|---|---|
| Baggage Hosts | empty | Hosts allowed to receive the W3C baggage header (store code and currency), one per line; a line also matches its subdomains. List your own services only |
| Trust Incoming Trace Headers | No | Continue traces started by callers that send traceparent headers. Enable only behind a trusted proxy or gateway |
| Server-Timing Response Header | No | Expose the trace context to browsers for RUM correlation. See Browser RUM |
Environment variables
Maho honors the standard OTEL_* environment variables, so 12-factor deployments can configure everything through the environment and leave the admin fields empty.
| Variable | Effect |
|---|---|
OTEL_SDK_DISABLED=true | Disables everything, wins over all other settings |
OTEL_SERVICE_NAME | Service name, overrides the admin field |
OTEL_RESOURCE_ATTRIBUTES | Extra resource attributes, e.g. deployment.environment.name=staging |
OTEL_EXPORTER_OTLP_ENDPOINT | Base OTLP URL; /v1/{signal} is appended per signal |
OTEL_EXPORTER_OTLP_TRACES_ENDPOINT, _LOGS_ENDPOINT, _METRICS_ENDPOINT | Per-signal URL, used verbatim |
OTEL_EXPORTER_OTLP_HEADERS | key=value,key2=value2, merged over the admin headers key by key |
OTEL_EXPORTER_OTLP_PROTOCOL | http/protobuf (default), http/json or http/ndjson; also per-signal _TRACES_ / _LOGS_ / _METRICS_ variants. grpc is not supported and falls back to http/protobuf with a warning. Environment only, there is no admin field |
OTEL_PROPAGATORS | Which context headers are read and written; default tracecontext,baggage. b3 / b3multi need open-telemetry/extension-propagator-b3 |
OTEL_TRACES_SAMPLER | always_on, always_off, traceidratio, parentbased_*; overrides the admin Sampling Rate |
OTEL_TRACES_SAMPLER_ARG | Ratio for the traceidratio samplers |
OTEL_LOGS_EXPORTER, OTEL_METRICS_EXPORTER | otlp or none, override the admin Export Logs / Export Metrics flags |
OTEL_SPAN_ATTRIBUTE_VALUE_LENGTH_LIMIT | Truncates long attribute values (a big db.query.text); unlimited by default |
OTEL_BSP_MAX_QUEUE_SIZE, OTEL_BSP_SCHEDULE_DELAY, OTEL_BSP_EXPORT_TIMEOUT, OTEL_BSP_MAX_EXPORT_BATCH_SIZE | Batch span processor tuning |
Precedence
The activation check runs in this order:
OTEL_SDK_DISABLED=truedisables everything, no matter what else is set.- The admin Enable Tracing flag enables tracing.
- Otherwise, the mere presence of
OTEL_EXPORTER_OTLP_ENDPOINTorOTEL_EXPORTER_OTLP_TRACES_ENDPOINTenables tracing.
Endpoint env vars activate tracing
Setting OTEL_EXPORTER_OTLP_ENDPOINT turns tracing on even when the admin flag is No. This is intentional: environment-driven deployments never touch the admin. Unset the variable, or set OTEL_SDK_DISABLED=true, to stop exporting.
For individual settings, the environment always wins over the admin field: OTEL_SERVICE_NAME replaces the Service Name, the endpoint variables replace the OTLP Endpoint, OTEL_TRACES_SAMPLER replaces the Sampling Rate, and OTEL_EXPORTER_OTLP_HEADERS is merged over the admin headers key by key. OTEL_LOGS_EXPORTER / OTEL_METRICS_EXPORTER override the two export flags in both directions (otlp forces on, none forces off).
Metrics
Export Metrics ships delta-temporality metrics to /v1/metrics (deltas because PHP processes are short-lived; the backend aggregates them):
| Metric | Type | Attributes |
|---|---|---|
http.server.request.duration | histogram (seconds) | http.request.method, http.response.status_code |
maho.orders | counter | maho.order.currency, maho.payment.method |
maho.order.revenue | counter | maho.order.currency |
maho.cart.additions | counter | none |
Log export
Export Logs ships every Monolog record to /v1/logs. It requires the open-telemetry/opentelemetry-logger-monolog package. Whenever tracing is active, log records already carry trace_id and span_id, so the backend can jump from a log line to the trace it belongs to, and back.
Logs leave the server as-is
Records are exported verbatim, at the same level as the local files: whatever any module (including third-party code) writes to the logs leaves the server. Enable this only against a backend you trust with the contents of var/log.
Data safety
The trace instrumentation never exports:
- HTTP request or response headers or bodies
- URL query strings or userinfo
- CLI command arguments
- Queue message payloads
- Warning/notice-level PHP error messages (only fatal-class errors include the message text)
Signed-in customers and admin users are identified by numeric id alone (enduser.id), never by name or email. The Authorization Header for the OTLP endpoint itself is stored encrypted.
A failed span carries the exception class in error.type and in its status description, never the message. The exception span event that accompanies an unhandled failure is the standard OpenTelemetry one, so it does carry exception.message and exception.stacktrace: treat the backend as holding whatever your code puts in exception messages.
Two settings deliberately export more, and both are named for what they do:
Query Statement (on by default)
Puts the SQL statement on every query span. Maho writes values into the statement with quoteInto() rather than binding them, so the statement carries those values: customer email addresses, password reset tokens, search terms, coupon codes. Turn it off if the OTLP backend must not hold customer data. Span names, timings and counts are unaffected.
Export Logs (off by default)
Ships Monolog records verbatim, so anything any module logs leaves the server. Enable it only against a backend you trust with the contents of var/log.
Sampling and cost control
Span volume is bounded by sampling, not by a per-trace cap. On an unsampled request no span is built at all, so no attribute is even computed. On a sampled request every operation is recorded: a page that runs 3000 queries produces 3000 spans. The intended tuning is:
- Lower the Sampling Rate rather than trimming what a trace contains.
0.1(the default) or0.01is plenty for a busy production store; complete traces at a low rate beat truncated traces at a high one. - Raise
OTEL_BSP_MAX_QUEUE_SIZEabove the default 2048 if very large traces drop spans. - Disable Trace Block Rendering on stores with complex layouts if block spans dominate.
- Leave Trace Cache Operations off except while debugging a cache problem.
- Use Excluded Paths for health checks and other high-frequency, low-value endpoints.
Telemetry is flushed after the response has been sent to the client, so page latency is unaffected. Each enabled signal (traces, logs, metrics) flushes sequentially though, so extra signals lengthen the worst-case time a PHP worker is held when the collector is slow or down. OTEL_BSP_EXPORT_TIMEOUT and the transport timeout (10 seconds, a single retry) bound it.
Distributed tracing
Outgoing requests
Every outgoing request through \Maho\Http\Client::create() carries a traceparent header, to every host: it contains two random ids and a sampled flag, nothing else. The baggage header (maho.store, maho.currency) only goes to hosts listed under Baggage Hosts, so a payment gateway or a shipping carrier never receives it. A listed host also matches its subdomains.
Queue messages
Dispatching a queue message stores the current W3C trace context on the message row, so the handler's consumer span joins the trace of the request that queued the work, even though that request is normally long finished when the handler runs. Sampling follows the dispatching request: work queued by an unsampled request is not traced either.
Incoming requests
Trust Incoming Trace Headers (default off) continues traces started by upstream callers that send traceparent headers, and sampling then honors the parent's decision (parent-based sampling). Which headers are read depends on OTEL_PROPAGATORS, so a caller sending B3 can be joined once open-telemetry/extension-propagator-b3 is installed. Only enable this behind a trusted proxy or gateway: honoring arbitrary client trace ids can pollute sampling decisions.
Browser RUM (Server-Timing)
Server-Timing Response Header (default off) sends the trace id to browsers in a Server-Timing header, so real-user-monitoring tools (e.g. Grafana Faro) can link page loads to backend traces. The header exposes only the W3C trace context (trace id, span id and sampled flag), no other data.
Custom spans in your code
Modules can add their own spans and attributes. Every call is null-safe and becomes a no-op when tracing is disabled or the request was not sampled:
$span = Mage::getTracer()?->startSpan('erp.sync', ['erp.entity' => 'product']);
try {
    // ... the work ...
    $span?->setAttribute('erp.items', $count);
} catch (\Throwable $e) {
    $span?->recordException($e);
    throw $e;
} finally {
    $span?->end();
}

// Shorthand for the same startSpan() call
$span = Mage::startSpan('erp.sync');

// Annotate whatever span is currently active
Mage::getTracer()?->getActiveSpan()?->addEvent('erp.batch.done', ['erp.batch' => $batchId]);
The span object also offers setAttributes(), setStatus(), updateName(), getTraceId(), getSpanId() and isRecording(). On hot paths, check Mage::getTracer()?->isRecording() before computing expensive attributes.
Profiler timers are another entry point: \Maho\Profiler::start('my.timer') / \Maho\Profiler::stop('my.timer') become spans automatically when the timer name matches one of the instrumented prefixes (OBSERVER:, BLOCK:, cron.job, email.send, image.process, index.reindex, payment., cache.).
Troubleshooting
"OpenTelemetry SDK not installed" in system.log. Tracing is enabled but the SDK packages are missing. Run composer require open-telemetry/sdk open-telemetry/exporter-otlp nyholm/psr7. Maho keeps serving requests untraced until then.
"OpenTelemetry enabled but no endpoint configured" in system.log. Enable Tracing is Yes but the OTLP Endpoint field and the endpoint environment variables are all empty.
No traces arrive. Check the sampling rate first (default 0.1: only 1 request in 10 is traced). Then confirm the endpoint ends with /v1/traces and the Authorization Header matches what the backend expects. On successful initialization Maho logs "OpenTelemetry tracer initialized successfully" at INFO level.
The collector is down. Requests keep working: the export runs after the response has been sent, fails after a 10-second timeout and a single retry, and logs the failure. The spans of that request are lost, and the PHP worker is held for the duration of the failed export, so do not point production at a collector that is frequently unreachable.
"OTLP over gRPC is not supported" in system.log. OTEL_EXPORTER_OTLP_PROTOCOL names grpc. Maho exports over OTLP/HTTP only and falls back to http/protobuf.
Config changes do not seem to apply. The tracer initializes once per request and caches its decision, so a change takes effect on the next request. Flush the configuration cache after changing the settings, as with any store configuration.